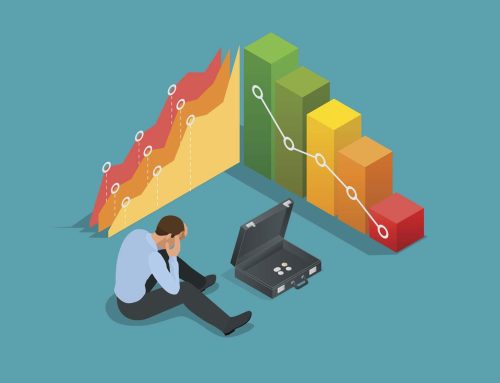

Since the end of the Great Recession, the U.S. hotel industry has been experiencing unprecedented growth. According to CBRE, 2016 ended with hotels achieving a higher historical occupancy than at any other time in history. And that’s with more hotels than ever before too.
You’ve experienced it at your hotels. Those crowded breakfast bars, myriad daily arrivals and departures, all fueled by a seemingly unyielding thirst for travel from Americans on both the business and leisure side. In fact, lodging demand grew 2.3% year-over-year in Q4, compared with 1.6% in Q3, pushing occupancy up to 60.7% in Q4, 2016, notes stats supplied by CBRE.
It all translated to a healthy average daily rate increase of 3.1% to US$124.41, in 2016, says a recent STR report.
In 2017 and 2018, expect more ADR increases pegged to be about 2.8% in each of 2017 and 2018, according to STR. That’s exciting news for hoteliers as it’ll mean more than 10 years of year over year growth if these predictions become reality.
At SkyTouch, we want to be sure your property is fully leveraging this current average daily rate (ADR) windfall. While you may believe you’ve pushed rates as far as you can, there may still be room for additional profitability by charging a few dollars more. This holds true even if you’re at record pricing.
Visit the SkyTouch calculator to see how just a few dollars’ difference in ADR can mean a big change to a hotel’s total annual revenue. The value calculator is a snap to use; simply enter your hotel’s room count, current ADR and average occupancy. Then type in the ADR you would like to achieve, and see how much more you could make.
For a 65-room hotel with a current ADR of $75 using the industry average of 70% occupancy, a $10 lift in rate can bring an extra $13,650, the equivalent to 47 week’s pay for a minimum wage employee (based on federal minimum wage guidelines of $7.25 per hour).
Customers using Skytouch’s real time rate management features are generally finding they can lift their hotel’s ADR quickly and easily. A Canadas Best Value Inn in Alberta, for example, reports that changing Best Available Rate level, or adding a special event, was a quick fix leading to higher results. This specific hotel reports seeing rates booked at up to $20 more for the last 15 rooms, compared to how much other rooms on the same night sold for.
When rates rise as more rooms are sold, a property’s overall ADR increases. A modern PMS system with automated rate management across all distribution channels, helps hoteliers avoid setting each rate one at a time. That means potentially making more money with less time spent.
“I don’t need to change the rates manually anymore, I just need to click one button, raise that rate or decrease that rate. I don’t need a lot of technical support to do it. SkyTouch rate management is awesome and really helped increase my revenue,” says Darren Yang, the general manager of the Stanton Inn and Suites, Stanton, CA.
Explore the complimentary rate calculator now. It takes only a few moments to discover how much even the smallest change to your ADR strategy can mean to the overall health of your property. Try it today.
*These calculators are for illustrative purposes only and are designed to be informational and educational tools only, and do not constitute financial or legal advice. The default figures shown are hypothetical only and may not be applicable to your individual situation. The calculations and results are based on a range of stated assumptions, as well as the figures you input, and are intended as hypothetical estimates only. Your individual results will vary. Do not rely on these calculators when you’re making decisions about financial or legal matters. Instead, we strongly recommend that you seek the advice of a financial services or legal professional. Choice Hotels International, Inc. and SkyTouch Technology, and their affiliates, expressly disclaim all liability and responsibility to any person who relies, or partially relies, on anything done or omitted to be done by these calculators, as well as any decisions or actions taken in reliance upon or as a result of the information provided by these tools.
**Past performance is not an indicator of future results. Individual results may vary.